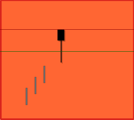
 | BEARISH HANGING MAN: The pattern occurs at the top of a trend or during an uptrend. The name Hanging Man comes from the resemblance of the candlestick to a hanging man. It is a single candlestick pattern characterized by a long lower shadow and a small body at or very near the top of its daily trading range. more... |
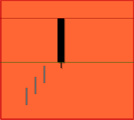 | BEARISH BELT HOLD: The Bearish Belt Hold is a single candlestick pattern, essentially a Black Opening Marubozu, that occurs in an uptrend. It opens at the day’s high, and then prices begin to fall during the day against the overall market trend, eventually closing near the day’s low, leaving a small shadow at the bottom of the candle. Longer bodies in the Belt Hold pattern indicate stronger resistance against the trend. more... |
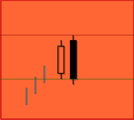 | BEARISH ENGULFING: This pattern is characterized by a large black candlestick engulfing a preceding smaller white candlestick, which appears during an uptrend. The black candlestick does not necessarily engulf the shadows of the white candlestick but completely engulfs the body itself. This is an important top reversal signal. more... |
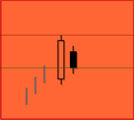 | BEARISH HARAMI: This pattern comprises a large white candlestick followed by a smaller black candlestick that is entirely contained within the range of the previous white candlestick. The pattern resembles a pregnant woman when outlined, hence the name. "Harami" is a Japanese term that means "pregnant." In this context, the larger white candlestick is referred to as the "mother," while the smaller black candlestick is the "baby." more... |
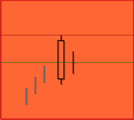 | BEARISH HARAMI CROSS: This is a significant bearish reversal pattern, surpassing the importance of a standard Bearish Harami. The pattern’s appearance is reminiscent of a Bearish Harami, resembling a pregnant woman. However, in this case, the "baby" is a Doji. Essentially, the pattern is characterized by a large white candlestick followed by a Doji that lies entirely within the range of the preceding bullish candlestick. more... |
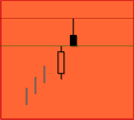 | BEARISH SHOOTING STAR: This pattern consists of a bullish (white) body followed by an Inverted Hammer, characterized by a long upper shadow and a small body. It is similar in appearance to the Bullish Inverted Hammer pattern. However, unlike the Bullish Inverted Hammer, the Shooting Star appears during an uptrend and signals a bearish reversal. more... |
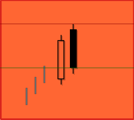 | BEARISH DARK CLOUD COVER: This is a top reversal pattern comprising two candlesticks. During an uptrend, a white candlestick appears on the first day. On the second day, the market opens at a new high, creating a gap up, and then closes more than halfway into the prior bullish candlestick’s body, resulting in the formation of a strong black candlestick. more... |
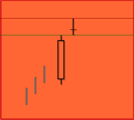 | BEARISH DOJI STAR: This pattern appears in an uptrend and signals a potential trend reversal. It consists of a white candlestick and a Doji with a gap up at the opening. If the Doji resembles an Umbrella, the pattern is called a "Bearish Dragonfly Doji". If it resembles an Inverted Umbrella, it is called a "Bearish Gravestone Doji". more... |
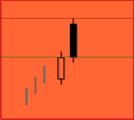 | BEARISH MEETING LINE: This pattern occurs during an uptrend. The first day’s white candlestick is followed by a black candlestick that opens sharply higher and closes at the same level as the prior session’s close. It is similar to the Dark Cloud Cover pattern; however, the amount the second day drops is different. The Dark Cloud Cover’s second day closes below the midpoint of the first day’s body, whereas the second day of the Bearish Meeting Line closes at the same level as the first day. more... |
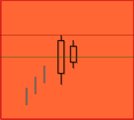 | BEARISH DESCENDING HAWK: This pattern features a small white candlestick enclosed within a preceding, relatively longer white candlestick. It resembles the Harami pattern, but with both candlesticks being white. more... |
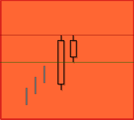 | BEARISH MATCHING HIGH: This pattern occurs when two consecutive white candlesticks appear in an uptrend, both having equal closing prices. It signals that a top has been reached, as the new high was tested but failed to hold, indicating a strong resistance level. more... |
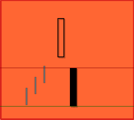 | BEARISH KICKING: This pattern starts with a white Marubozu followed by a black Marubozu. After the white Marubozu, the market opens below the previous session’s opening price, creating a gap between the two candlesticks. more... |
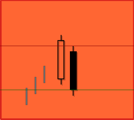 | BEARISH ONE BLACK CROW: This pattern appears in an uptrend and includes a white candlestick followed by a black candlestick. The black candlestick opens below the previous day’s close and closes below its own opening price. This pattern is similar to the Bearish Harami, with the key difference being that the second day’s close is lower, preventing the black body from being engulfed by the preceding white body. more... |
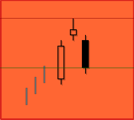 | BEARISH EVENING STAR: This is a three-candlestick formation indicating a significant top reversal. It consists of a white candlestick followed by a small candlestick, which typically gaps up to form a star. The third candlestick is black and closes well within the bullish candlestick’s real body from the first session. This is a notable reversal pattern. more... |
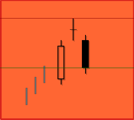 | BEARISH EVENING DOJI STAR: This is a three-candlestick pattern indicating a major top reversal. It consists of a white candlestick followed by a Doji, which typically gaps up to form a Doji Star. The third candlestick is black and closes well within the real body of the bullish candlestick from the first session. This is a notable reversal pattern. more... |
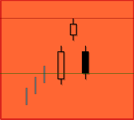 | BEARISH ABANDONED BABY: This three-candlestick pattern signals a major top reversal. It is similar to the Bearish Evening Doji Star but with one key difference: the shadows on the Doji must also gap above the shadows of the first and third days. The pattern’s name originates from the second day, where the Doji appears to float alone on the chart like an abandoned baby between the first and third days. Essentially, the pattern consists of a white candlestick followed by a Doji that gaps away (including shadows) from the previous white candlestick and the subsequent black candlestick, which closes well within the first candlestick’s real body. more... |
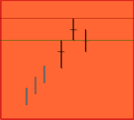 | BEARISH TRI STAR: This pattern consists of three consecutive Doji candlesticks. The occurrence of such a pattern is extremely rare, making it highly noteworthy when it does appear. more... |
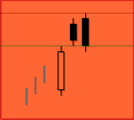 | BEARISH UPSIDE GAP TWO CROWS: This is a three-candlestick bearish reversal pattern. The gap between the black body of the second day and the white body of the first day is known as the upward gap. The second and third black candlesticks are referred to as the two black crows. more... |
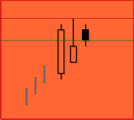 | BEARISH UNIQUE THREE MOUNTAIN TOP: This is a three-candlestick pattern that somewhat looks like the Bearish Evening Star. It appears in an uptrend. The first day’s white candlestick engulfs the following small white body, which characteristically has a long upper shadow. The pattern is completed by a small black body, which closes above the close of the second day. more... |
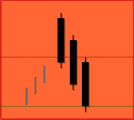 | BEARISH THREE BLACK CROWS: This pattern indicates a strong market reversal. It is characterized by three normal or long candlesticks that progressively decrease in value. Each day opens slightly higher than the previous day’s close, but prices progressively close at lower levels. This staircase-like behavior signals a trend reversal. more... |
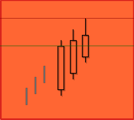 | BEARISH ADVANCE BLOCK: This pattern consists of three consecutive white candlesticks with consecutively higher closes in an uptrend. more... |
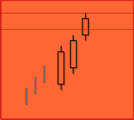 | BEARISH DELIBERATION BLOCK: This pattern consists of three consecutive white candlesticks with consecutively higher closes in an uptrend. more... |
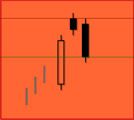 | BEARISH TWO CROWS: This pattern is a made up of three candlesticks. The black candlesticks of the second and third day represent the two crows that perched on the first white candlestick. more... |
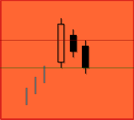 | BEARISH THREE INSIDE DOWN: This is a confirmed Bearish Harami pattern. The first two candlesticks match the Bearish Harami formation, and the third day provides bearish confirmation. more... |
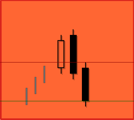 | BEARISH THREE OUTSIDE DOWN: This is a confirmed Bearish Engulfing pattern. The first two candlesticks follow the classic Bearish Engulfing pattern, and the third day provides its confirmation. more... |
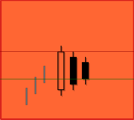 | BEARISH SQUEEZE ALERT: This is a three-day bearish reversal pattern. It was developed because of the frequent event where prices can break to the downside following this pattern, especially if the pattern is preceded by a strong upside move. more... |
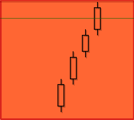 | BEARISH THREE GAP UPS: This is a four-day bearish reversal pattern. It consists of three consecutive days, each opening with a gap up. After Three Gap Ups, the market becomes significantly overbought, signaling a potential reversal of the current uptrend. more... |
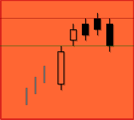 | BEARISH BREAKAWAY: This four-candlestick pattern begins with a strong white candlestick. The following three days, after an upside gap, see consecutively higher prices. However, on the last day, the limited price gains of the previous days are completely erased, and it closes within the gap between the first and second days. This indicates a potential short-term reversal. more... |
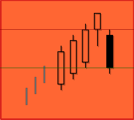 | BEARISH LADDER TOP: This is a five candlestick pattern that starts with three strong white candlesticks. The uptrend continues with the fourth higher close. The next day gaps lower and closes much lower than the previous day or two. This may imply a bearish reversal. more... |
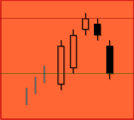 | BEARISH AFTER TOP GAP DOWN: This is a five candlestick pattern that starts with three white candlesticks. The market signals a top reversal with the change in the color at the fourth candlestick. The next day gaps lower and makes a strong downward move, confirming the reversal. more... |
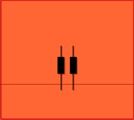 | BEARISH STOP LOSS: The Bearish Stop-Loss Pattern is not a standard candlestick pattern. It serves as the stop-loss complement for all confirmed bullish patterns. The conditions for activating the Bearish Stop-Loss are two consecutive lows or a close below the stop-loss level of a recently confirmed bullish pattern. more... |